Viewing Brute Force and Nmap Logs Through Security Onion / Kibana
In this article, I'll be doing log monitoring using Security Onion, which I set up on a virtual machine, and the Kibana instance that comes with it. Here, I'll go…

Hello everyone. :)
In this article, I’ll be doing log monitoring using Security Onion, which I set up on a virtual machine, and the Kibana instance that comes with it. Here, I’ll go through the following steps, in order:
- port scanning with nmap,
- a BruteForce attack against the SSH service with hydra,
- detecting these activities and monitoring the logs in security onion and kibana.
I’ll carry out my steps in order, under the headings above.
What Is Security Onion?
Security Onion is a free, open-source Linux distribution built for intrusion detection, network security monitoring, and log management.
It includes Elasticsearch, Logstash, Kibana, Snort, Suricata, Bro, Wazuh, Sguil, Squert, CyberChef, NetworkMiner, and many other security tools. You can find more detail and information here.
- First, below you can see the Security Onion instance set up on my virtual machine.

Port Scanning with Nmap
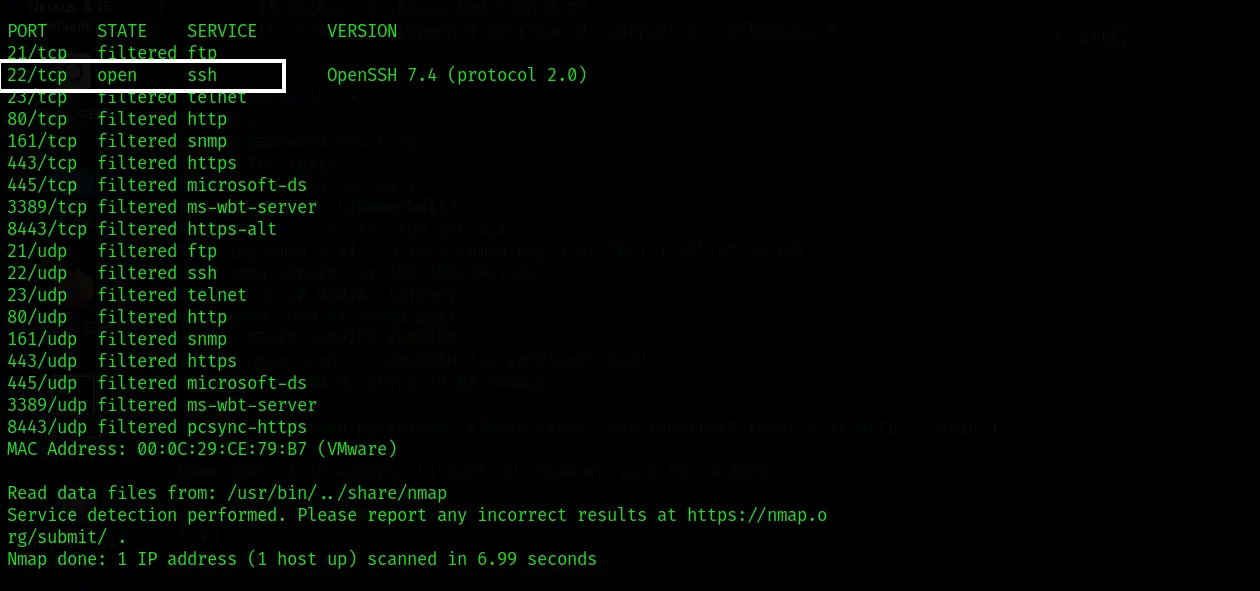
- Here, we use the nmap tool by running the command below. You can enter the IP address you want to scan in the target IP address field.

- As a result of our service scan, we saw that the SSH service was open. I wanted to run a BruteForce attack against the SSH service and included it in this article. I also wanted to see the resulting logs and understand how they differ.
BruteForce Against SSH with Hydra
- I’m running the command needed to launch a BruteForce attack against the SSH service. Since my goal here was just to monitor the logs, I didn’t create a separate password list and instead used Kali’s built-in rockyou.txt password list.

- If the BruteForce attack starts and proceeds successfully, you’ll see output like the following.

Monitoring the Logs via Security Onion and Kibana
Here, I log in through localhost using my browser, and I’m greeted with the screen shown below.
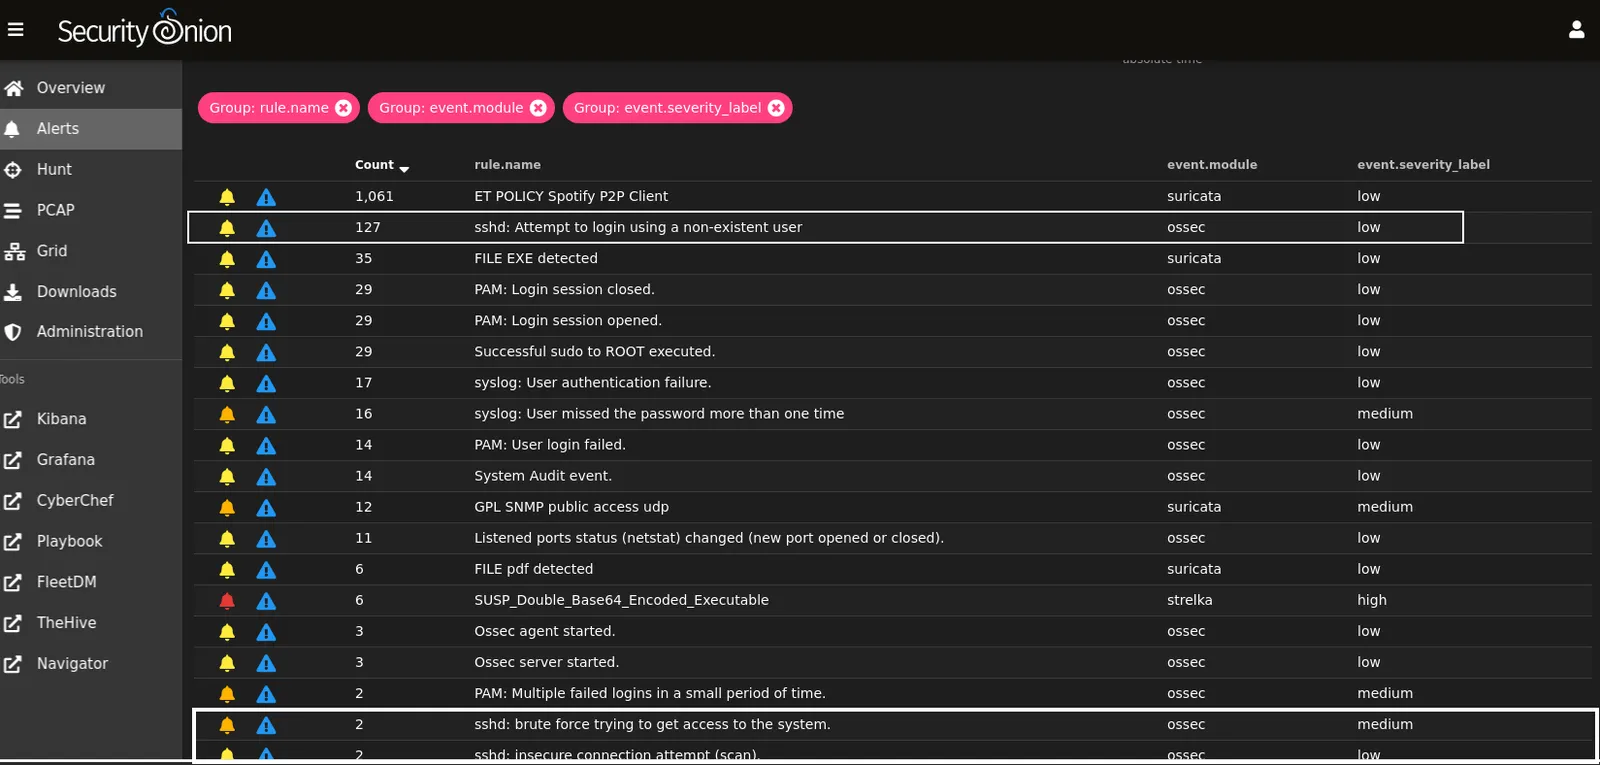
- As you can see on this screen, all the logs we need to monitor and analyze are displayed here.
- You can see the logs from my nmap scan and from the BruteForce attack in the boxes below, and you can examine them in detail from here.
What Is Kibana?
Kibana is an advanced visualization tool used to visualize data stored in Elasticsearch through charts and graphs.
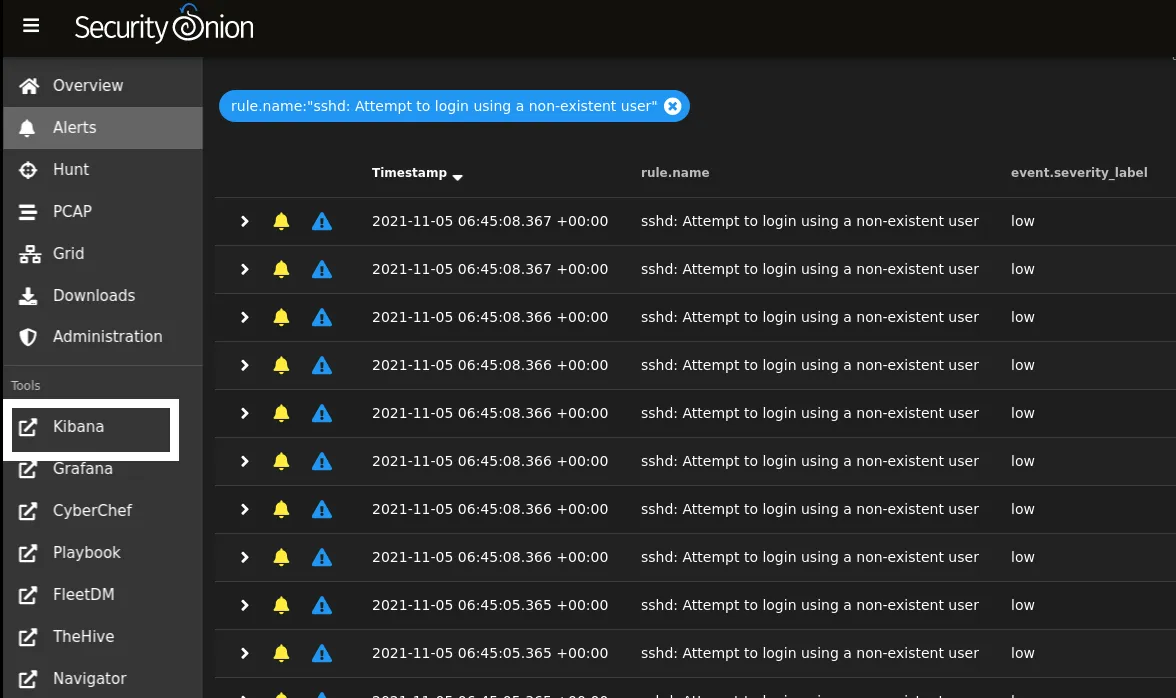
- To access the logs through the Kibana interface, we first click the Kibana option, as shown below. You can access the Kibana interface by entering your credentials on the login screen that appears.
What Is Strelka?
Strelka is a real-time file scanning system used for threat hunting, threat detection, and incident response. It’s a design created by Lockheed Martin’s Laika BOSS and similar projects. Strelka’s purpose is to perform file extraction and metadata collection at scale.
Strelka scans files using YARA rules. If it detects a match, it generates an alert that can be found in Alerts, Hunt, or Kibana.
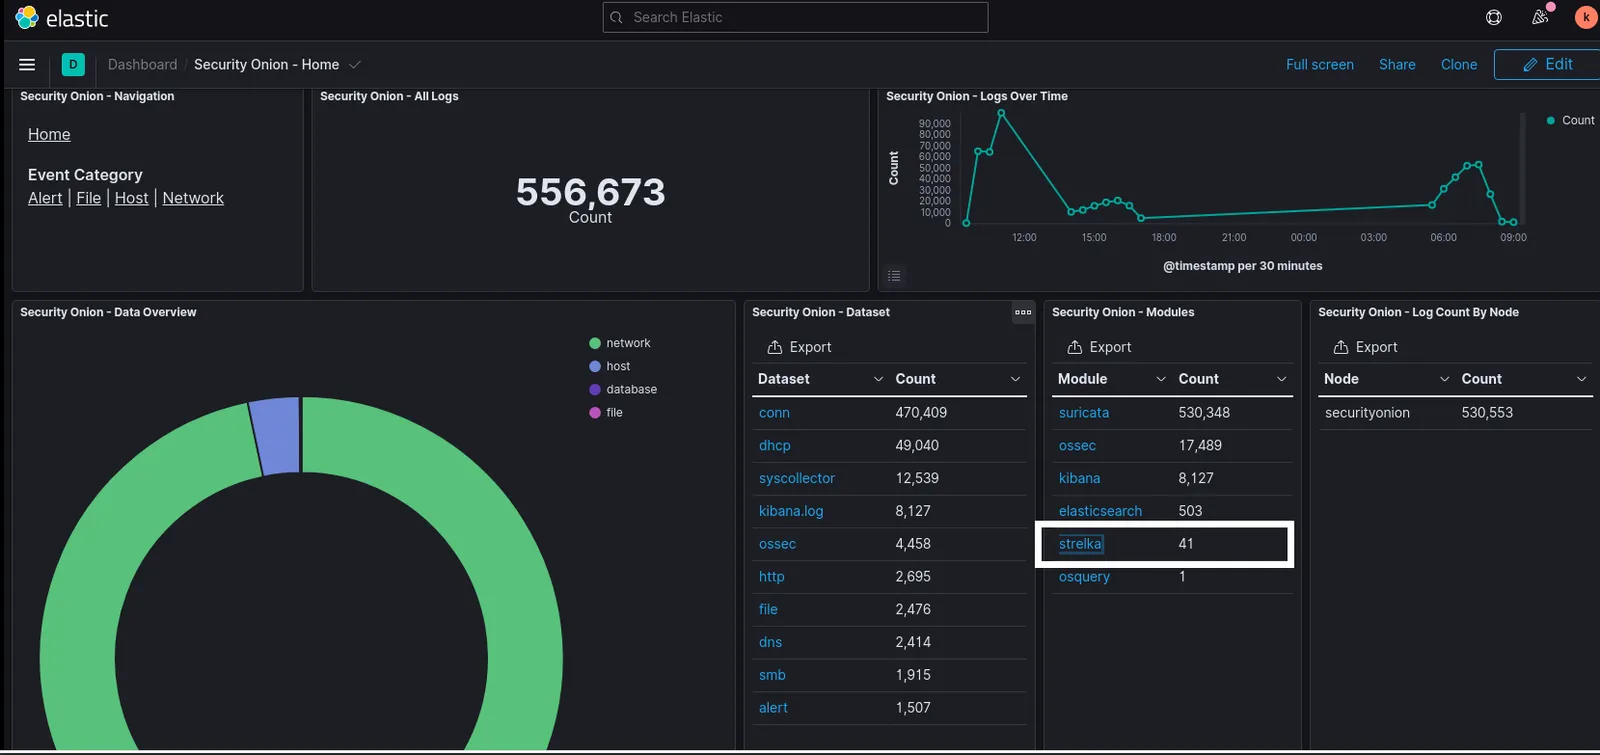
- All the logs that land in Kibana show up in front of us. Since our logs are under Strelka, we click on that tab.
- We continue by selecting the Alert section.
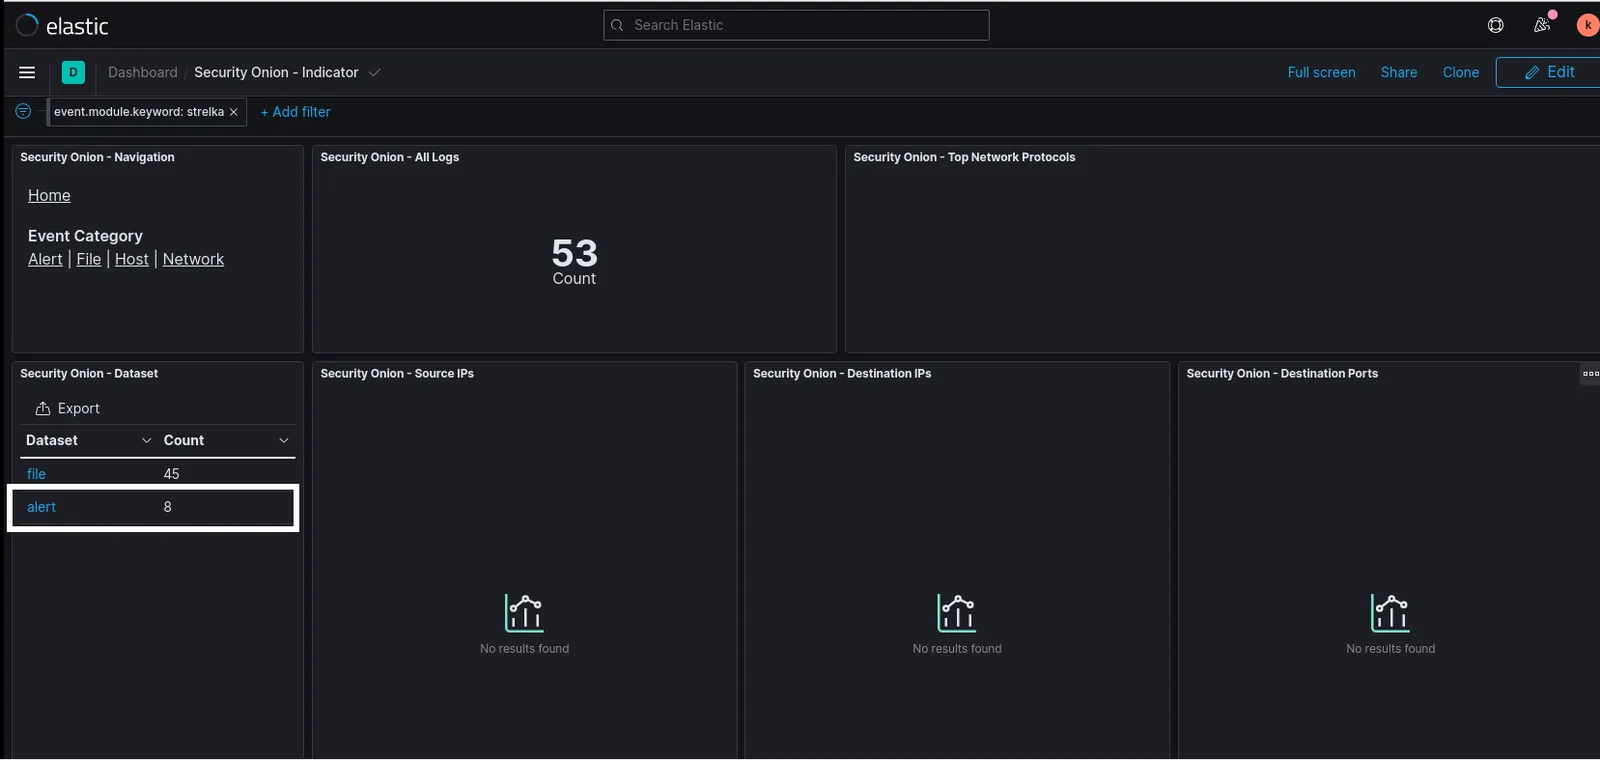
- I can see my own Kali machine’s IP address. I click on this IP address.
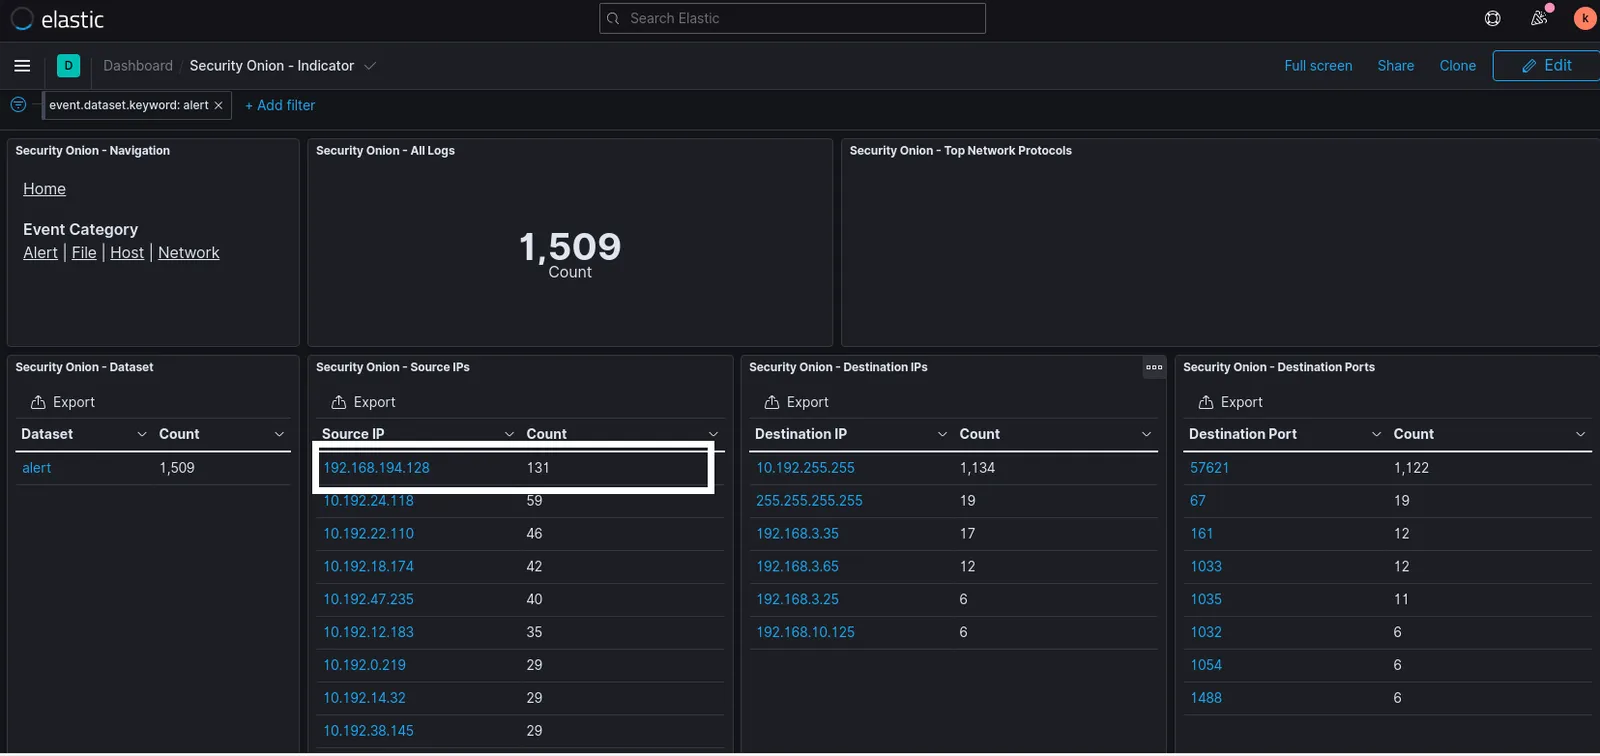
- Here, we can view all the logs coming from my Kali machine’s IP address. I click on one of them to view its contents.
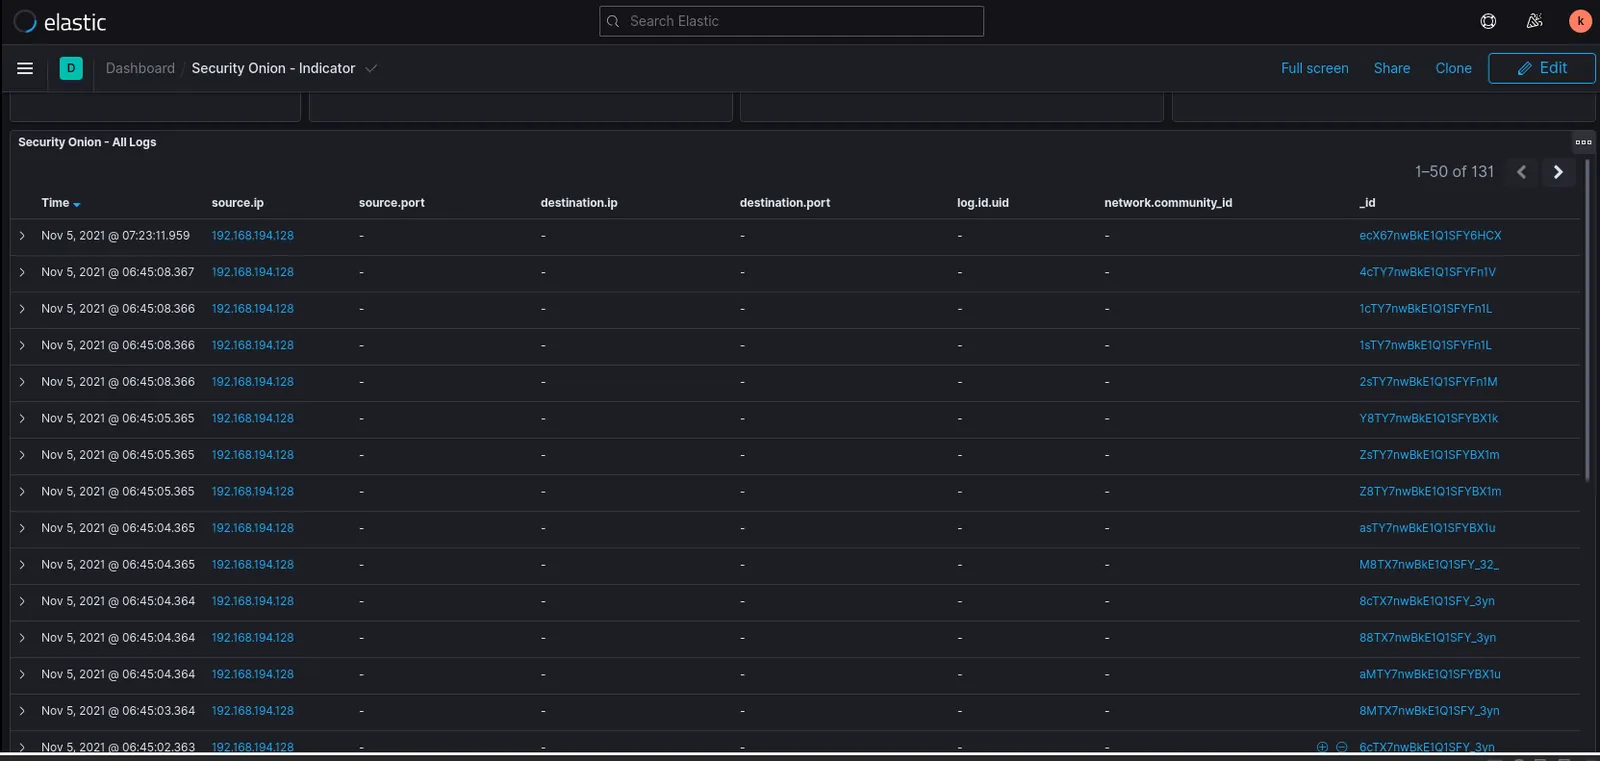
- When we examine any one of these logs, we get output like the following. You can scroll down for a more detailed look.
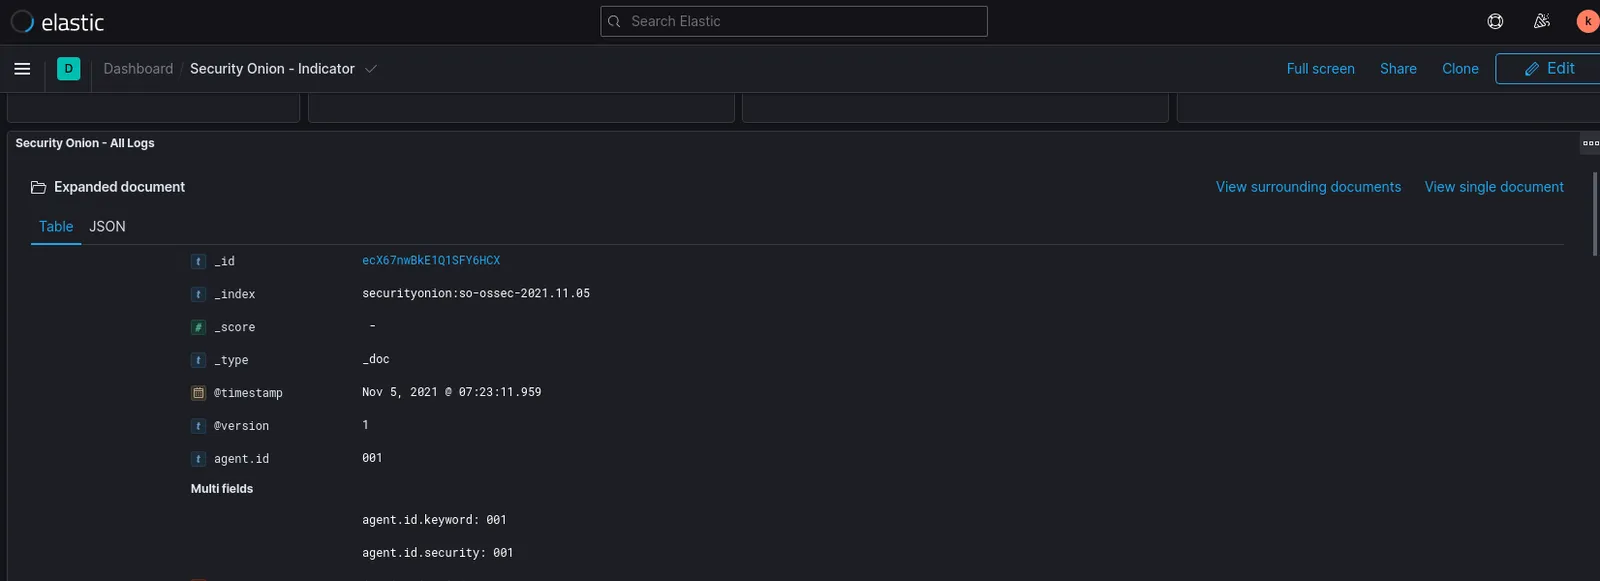
- Here you can see how the logs land and what their contents look like, as shown in the image. In the log entry shown, you can see the timestamp value, which rule triggered the log, the MITRE tactic, technique, and procedure, along with a lot of other information.
- In the two boxes below, we can see, in order, an entry described as an “insecure connection attempt.”
- According to MITRE, you can see ID = “T1043”, Tactic = “Command and Control”, Technique = “Commonly Used Port”. If you look into this description in more detail, you’ll understand that it corresponds to a port scan log.
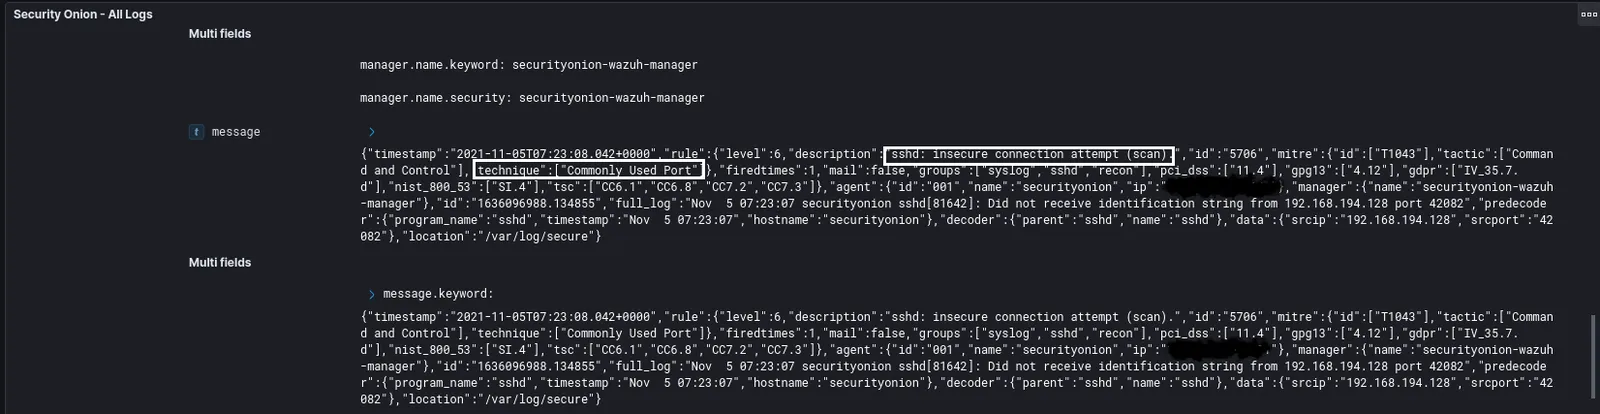
- In this log, we see the log entry for the Brute Force attack we carried out. Here again, you can research and learn more detail by looking at the alerts shown in the box.
- Based on MITRE’s technical description alone, you can tell that this is a Brute Force attack.

Thanks for reading this far. If you spot any errors in this article, I’d really appreciate it if you got in touch with me. :)