T-POT Honeypot Setup, Configuration, and Viewing via Kibana
In this article, I'll talk about how to set up a T-POT honeypot on virtualization and how to review the logs there. What is a Honeypot?…

Hello everyone. :)
In this article, I’ll talk about how to set up a T-POT honeypot on virtualization and how to review the logs there.
What Is a Honeypot?
A honeypot is a system designed to trap attackers who are trying to compromise a system or gather information about it. Honeypots can be a computer or server that appears to be part of the network it sits in. Honeypots are an important resource that appear to attackers as a target device, but are actually isolated and aimed at monitoring the attackers’ movements.
T-POT Honeypot
T-POT is a Debian-based honeypot system that bundles multiple honeypot tools in a preconfigured form, served through a Docker infrastructure.
The features of T-POT can be listed as follows;
- An intelligence database can be built by detecting the tools or IPs belonging to attackers as a result of port scans performed by attackers.
- The usernames, passwords, etc. that attackers try on the system can be detected and a database can be built from them.
- Movements that attackers make within the internal network can be detected.
Setup Requirements
- 8GB RAM
- 128GB SSD
- Network via DHCP
- A working internet connection with no proxy
Installation
The installation is quite simple. It largely depends on having a working, proxy-free internet connection. Otherwise, the installation will fail.
First, we download the iso file from here. After downloading the file, I install it on a virtual machine. After completing the necessary configuration and meeting the system requirements, the first installation screen appears as follows.
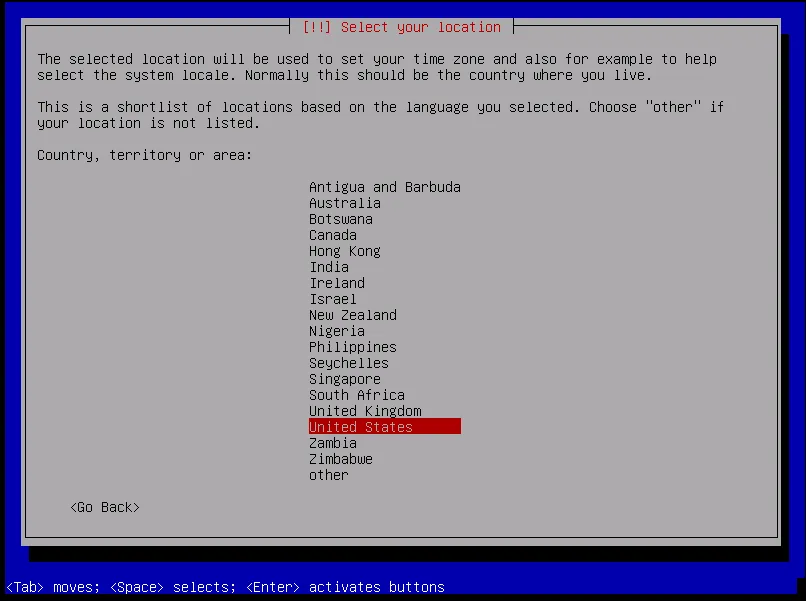
- Here, I’ll generally proceed using United States as the location.
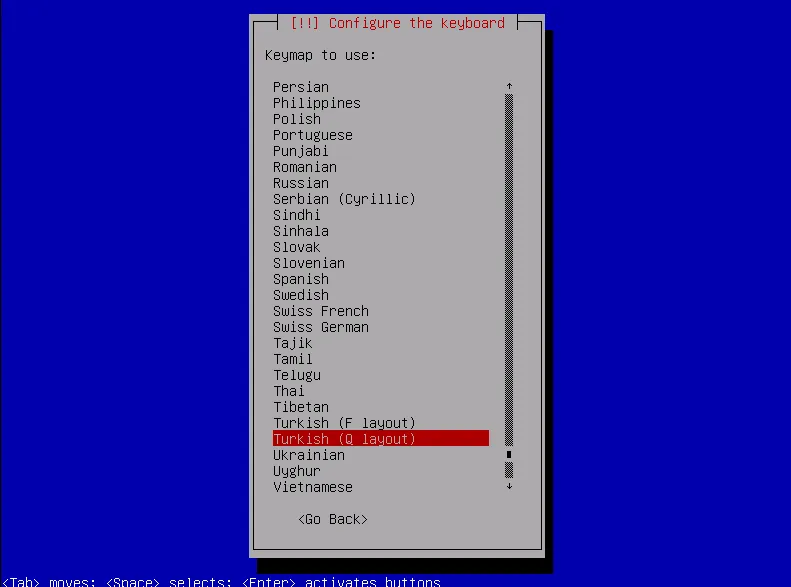
- We select our keyboard language.
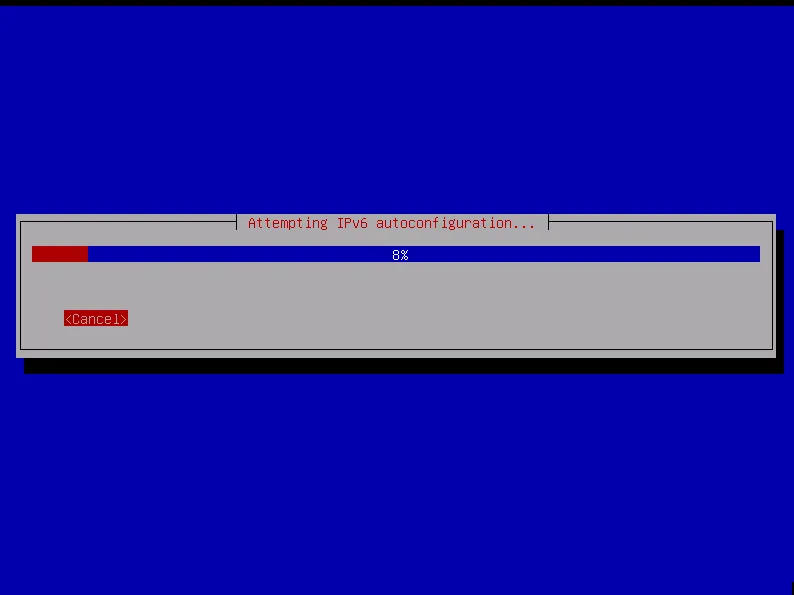
- The configuration screen appears as shown in the image.
- Again, we make our own selections as shown in the image.
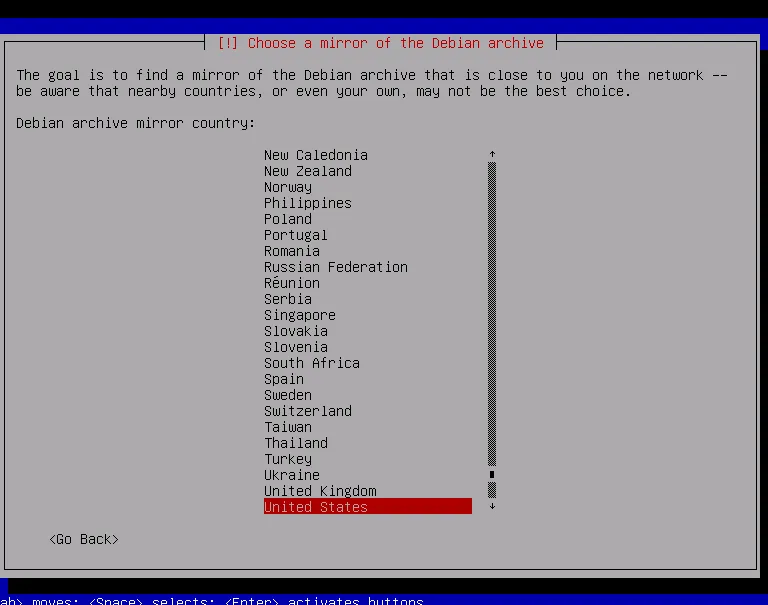
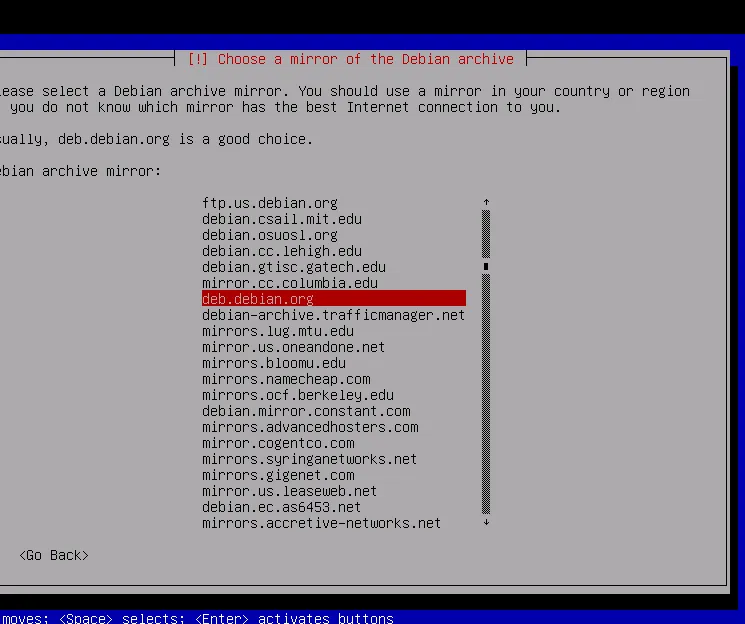
- We select the Debian archive like this.
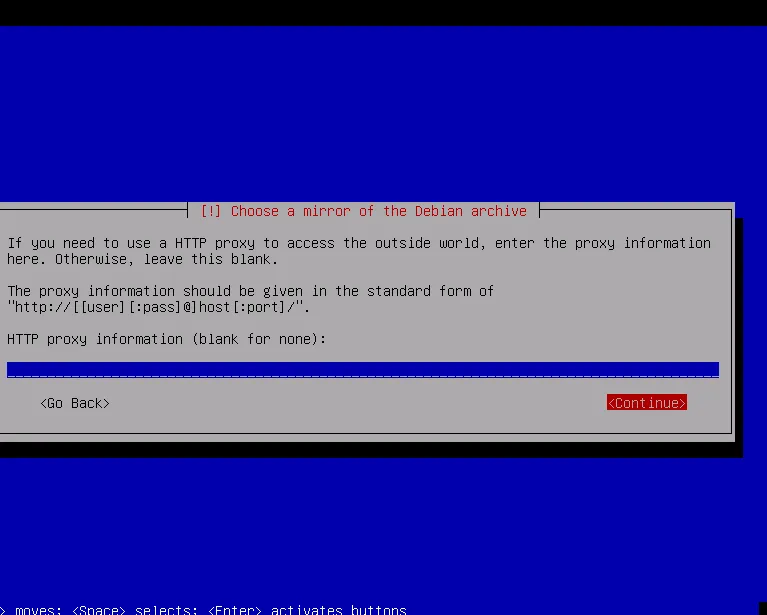
- We leave this blank and continue.
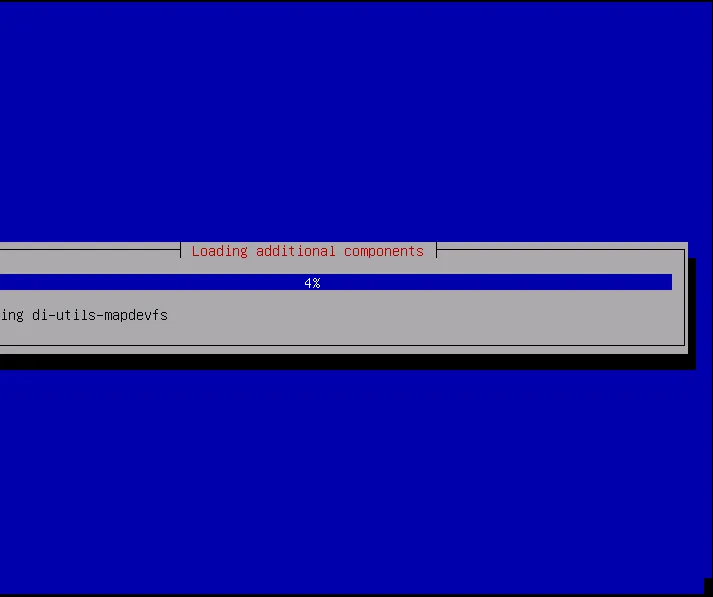
- We wait for the installation screen.
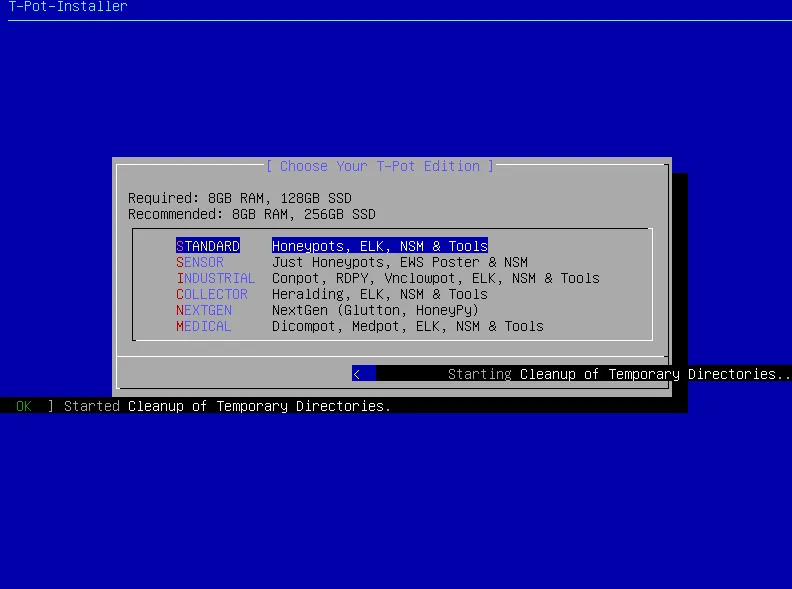
- An important screen like this comes up during installation. If you’re not going to use a distributed setup and the system will be installed on a single server, we proceed by selecting the “STANDARD” option. This will be sufficient for these test trials.
- At this point, it asks us for a username and password. Since it asks for some information twice here, I’m sharing these screens with you as well.
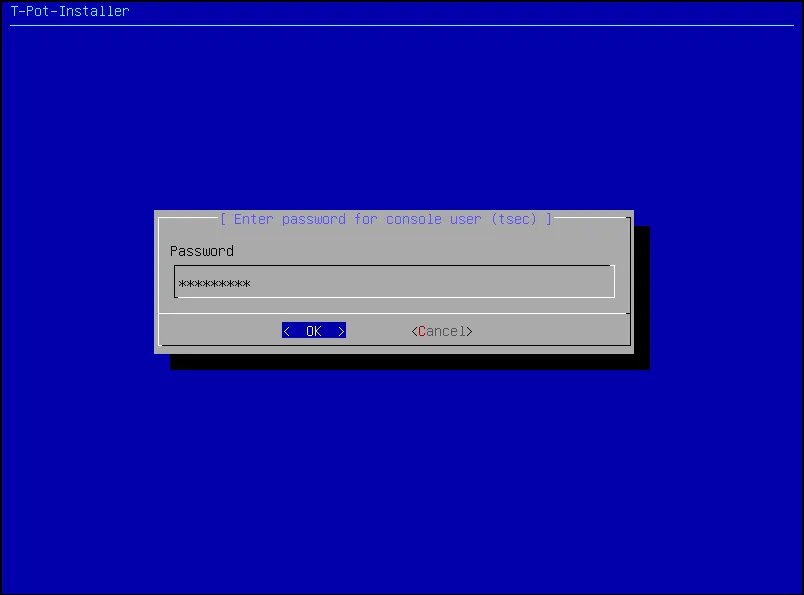
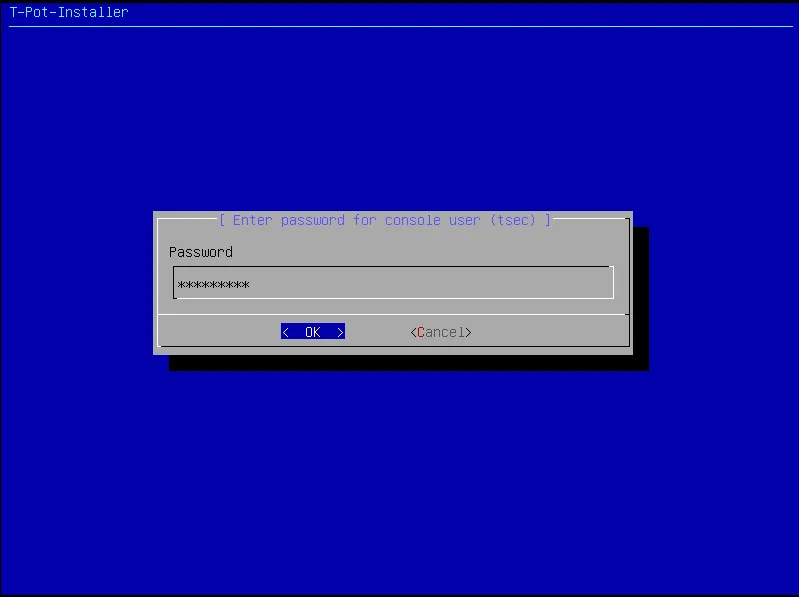
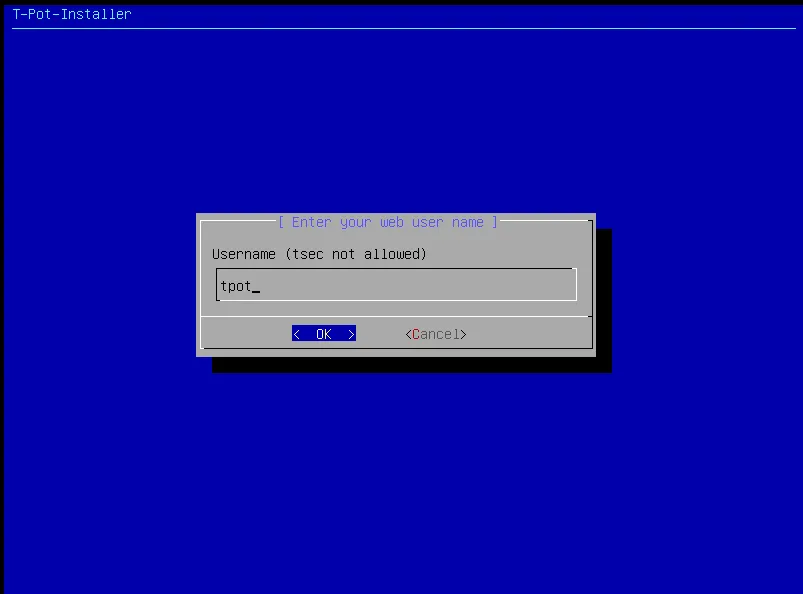
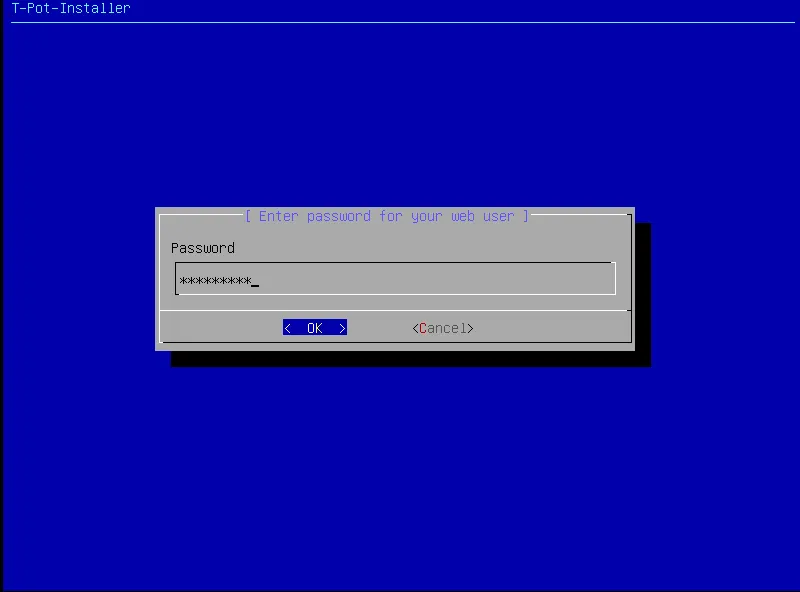
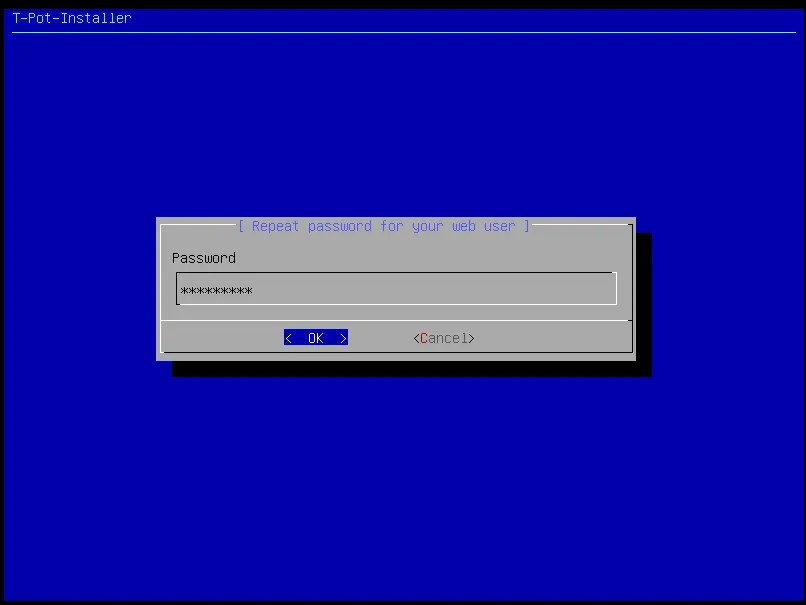
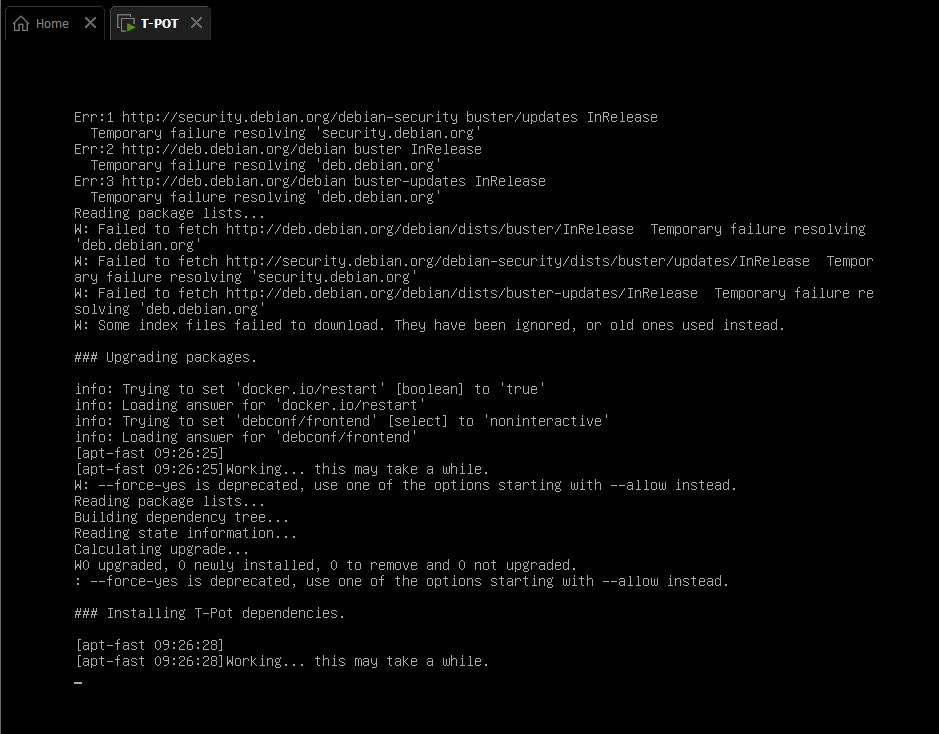
- After providing the required username and password information, an installation screen like the one below appears.
- When the installation finishes, we’re presented with a screen like the one below. As you can see here, the admin, web, and SSH connection details are printed on screen.
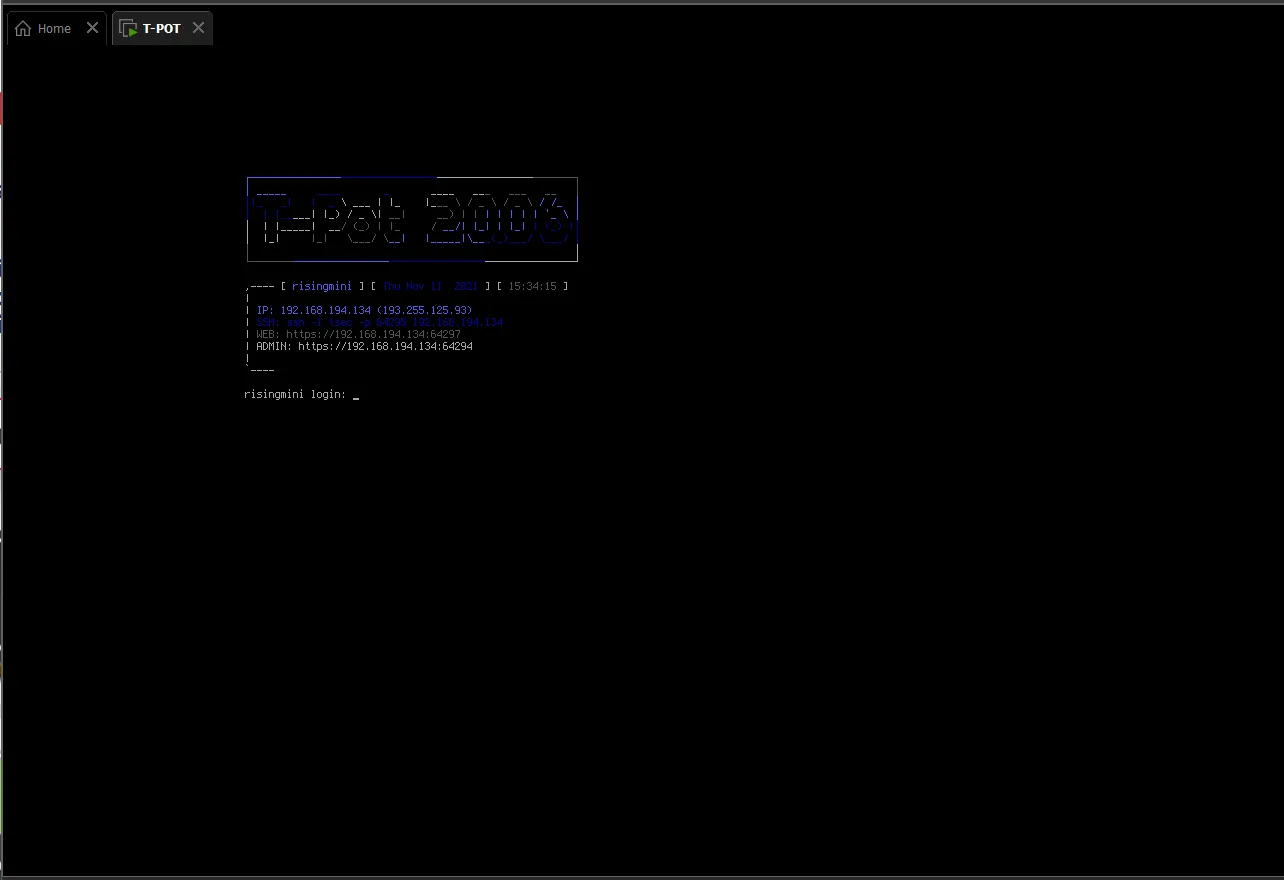
- First, we use the information from the previous screen to connect to the admin interface.
- Then we enter the username and password.
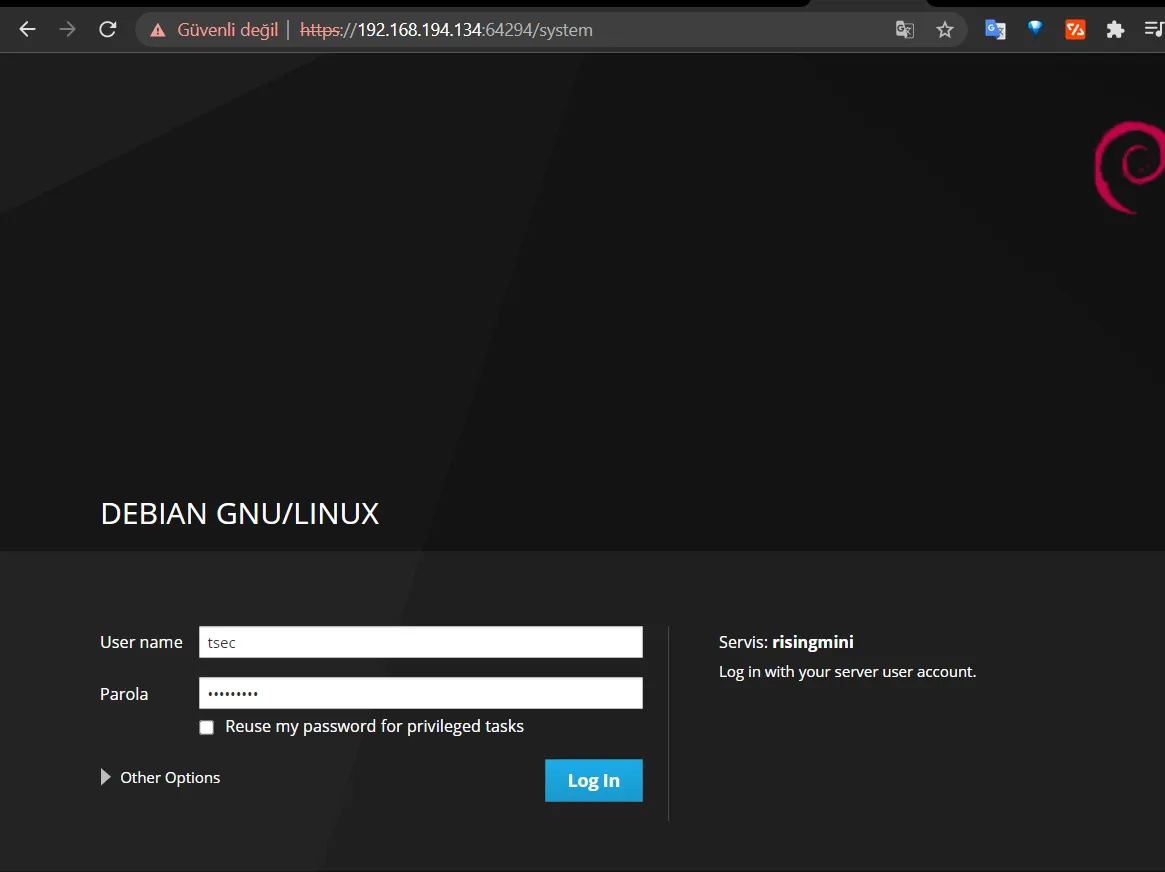
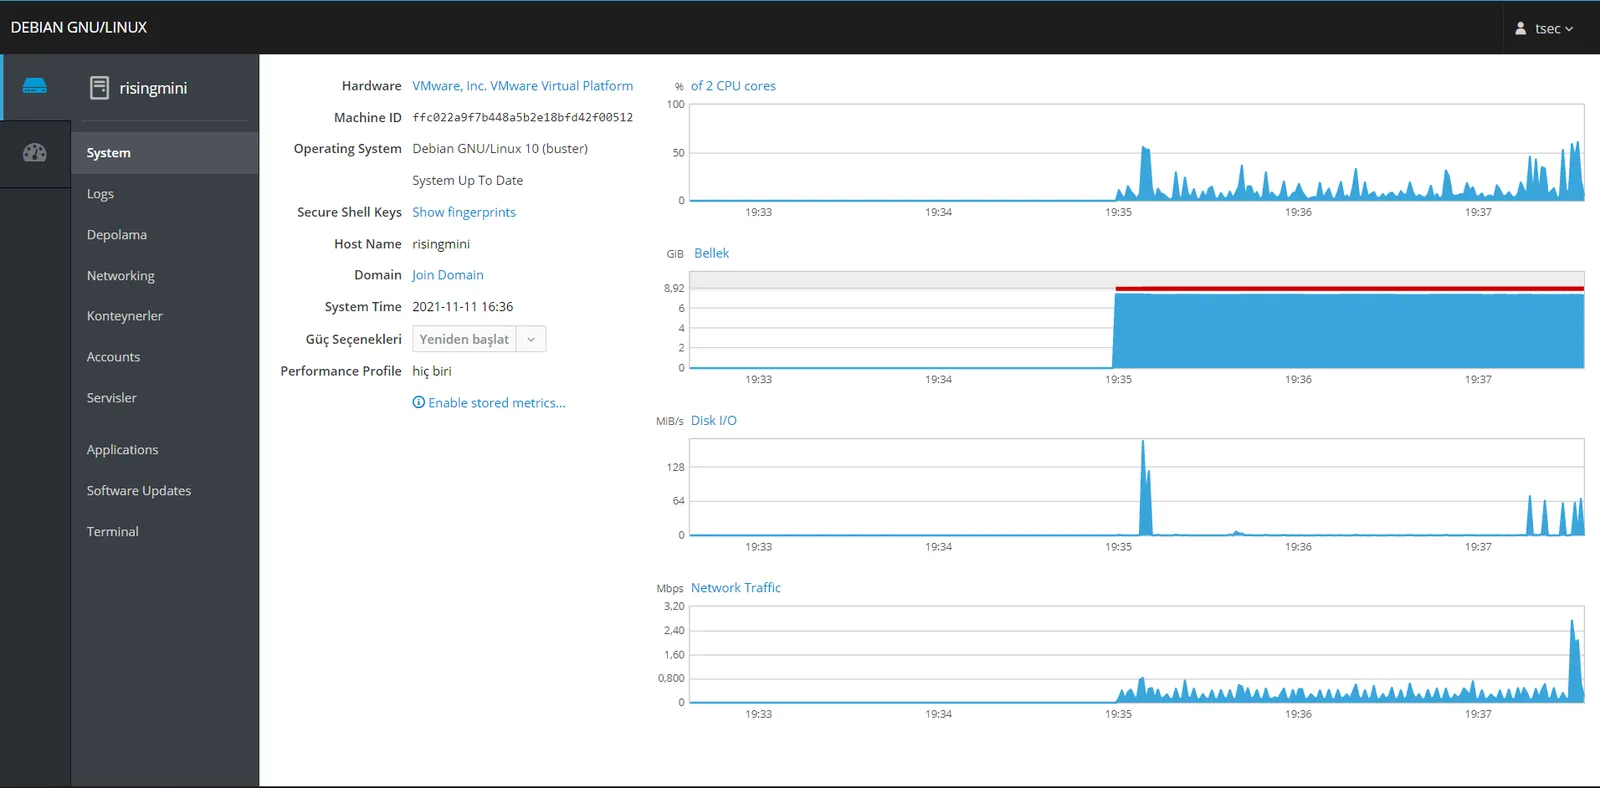
- The first screen we see in the interface is as follows.
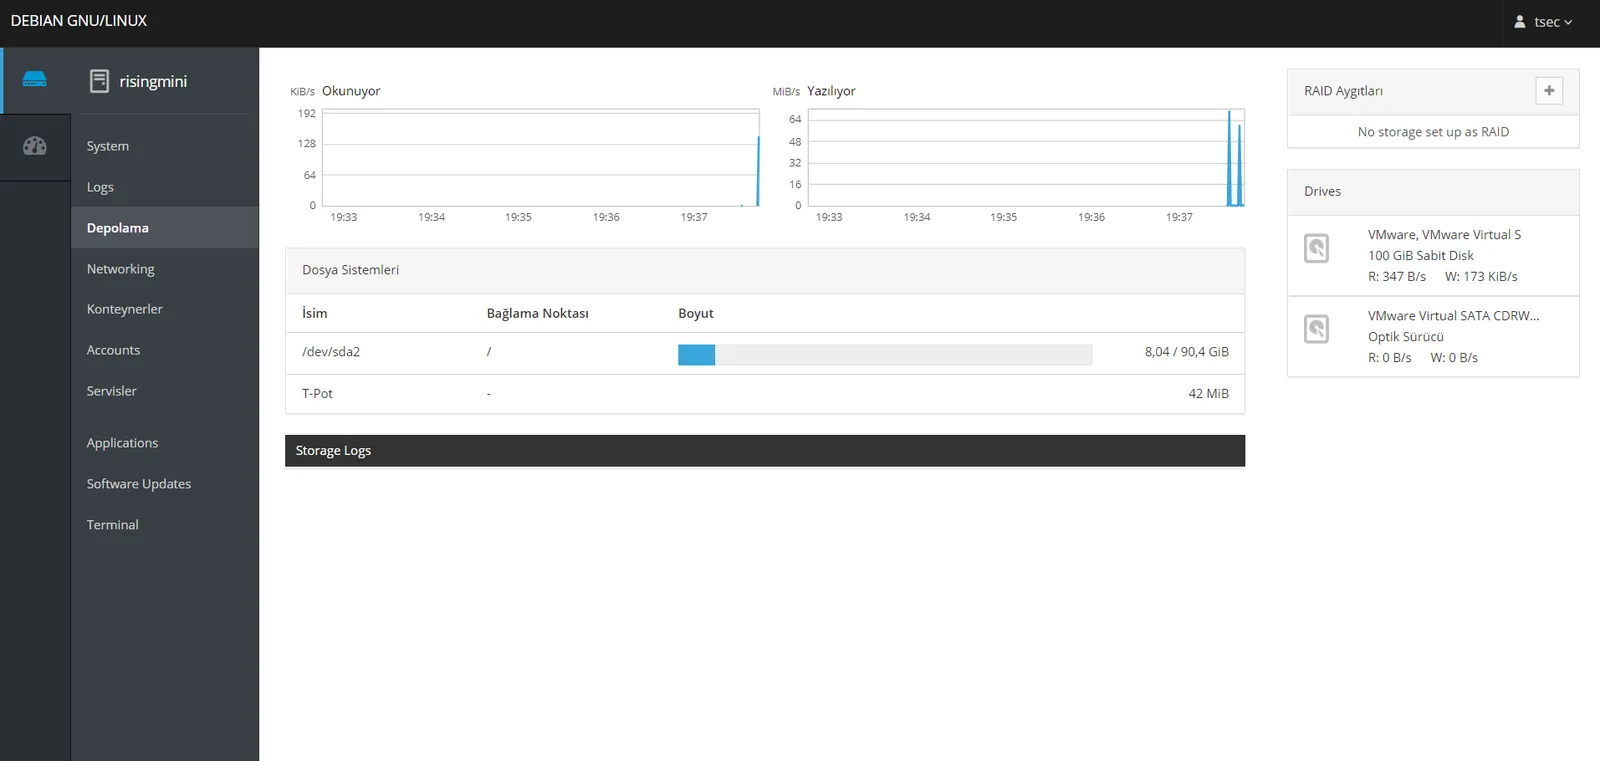
- This is the storage screen located right below.
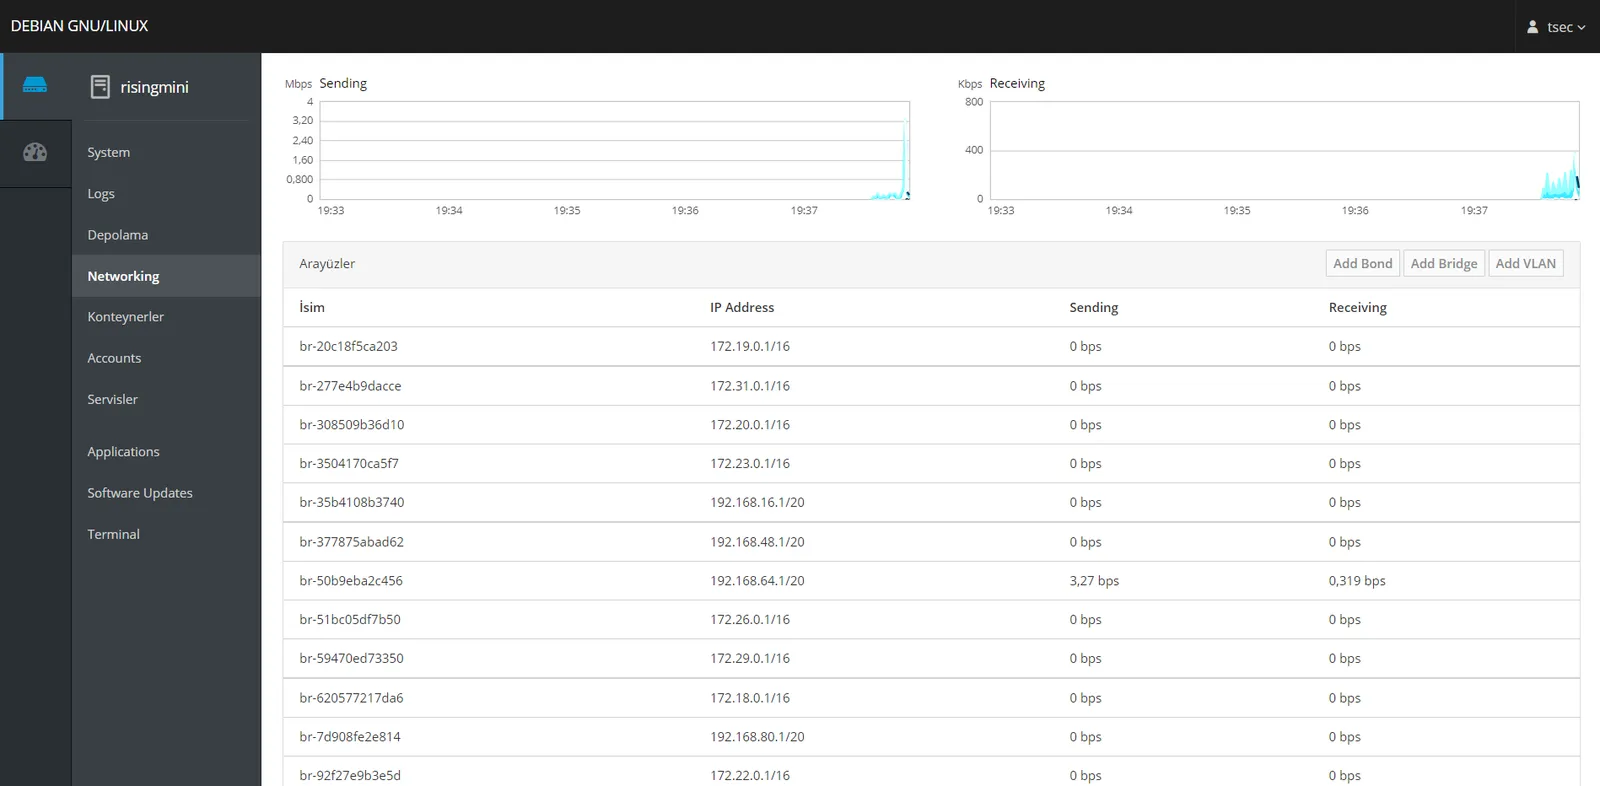
- The Networking screen,
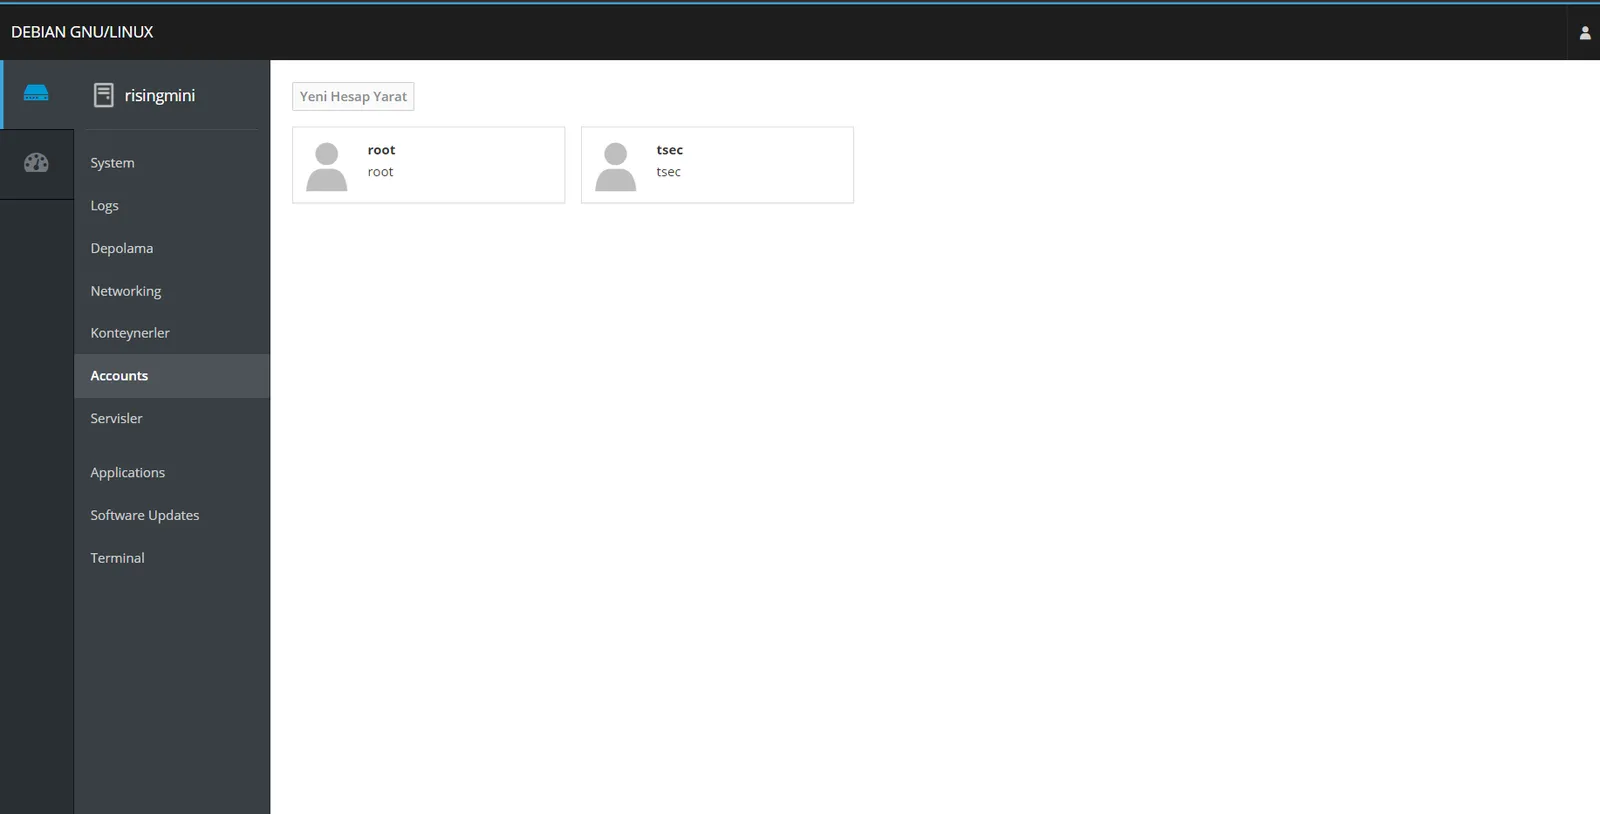
- The screen where the accounts are located,
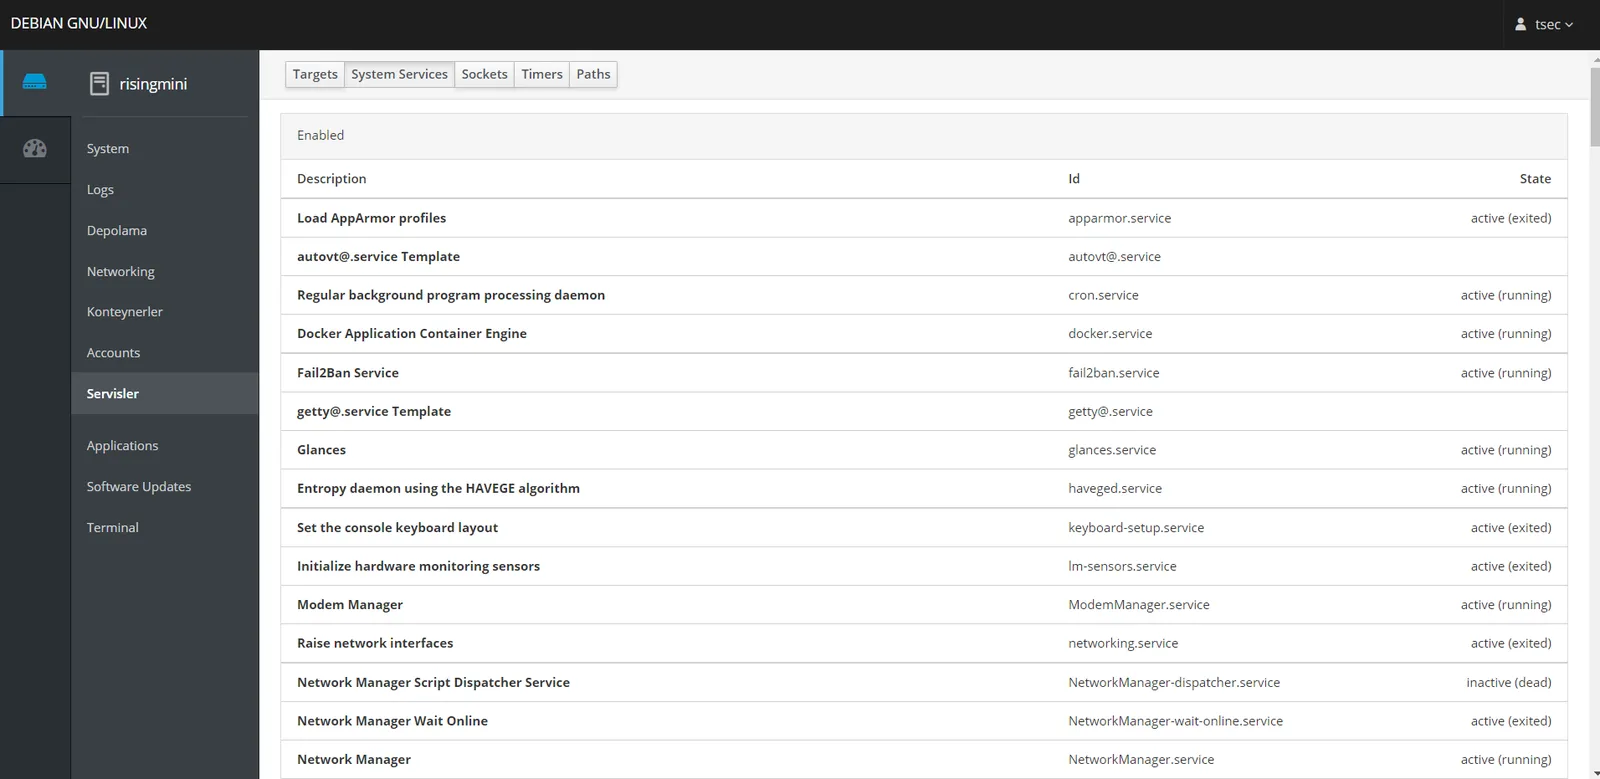
- The screen listing the services,
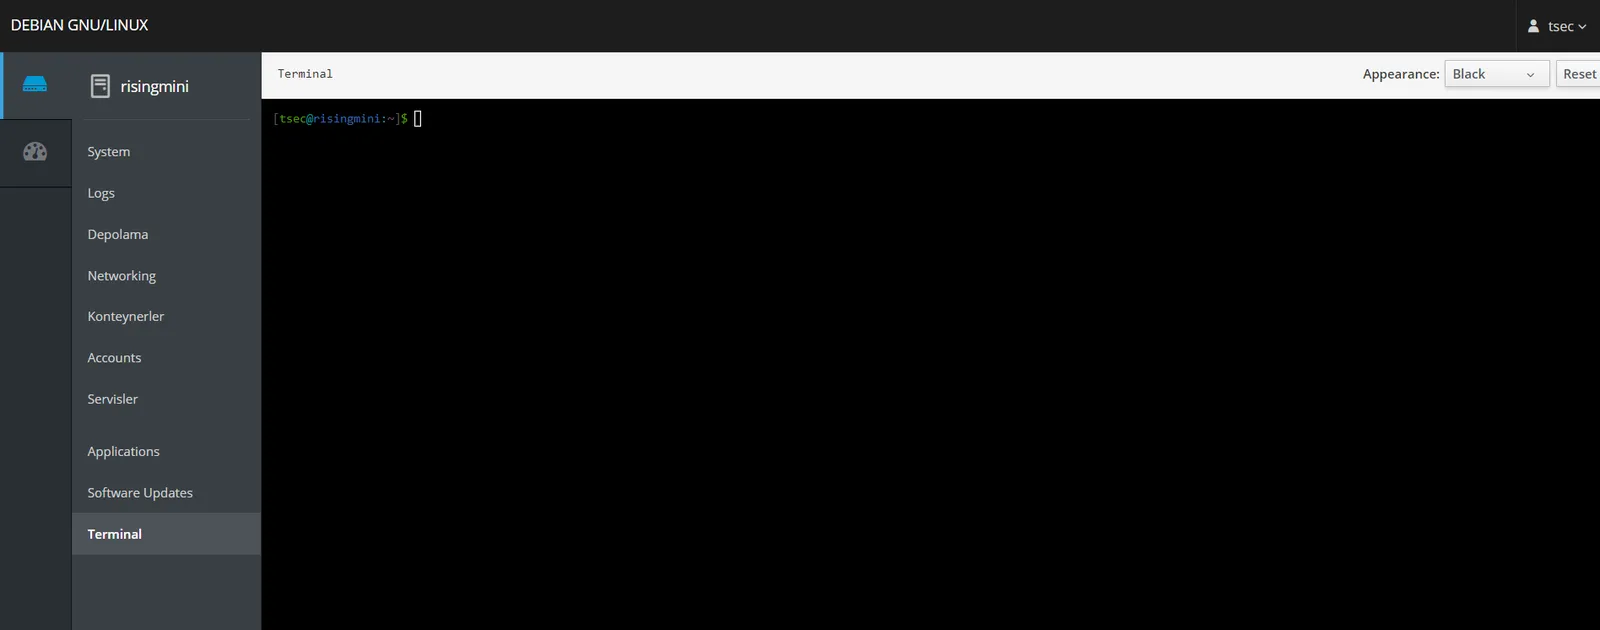
- Here you see the terminal screen.
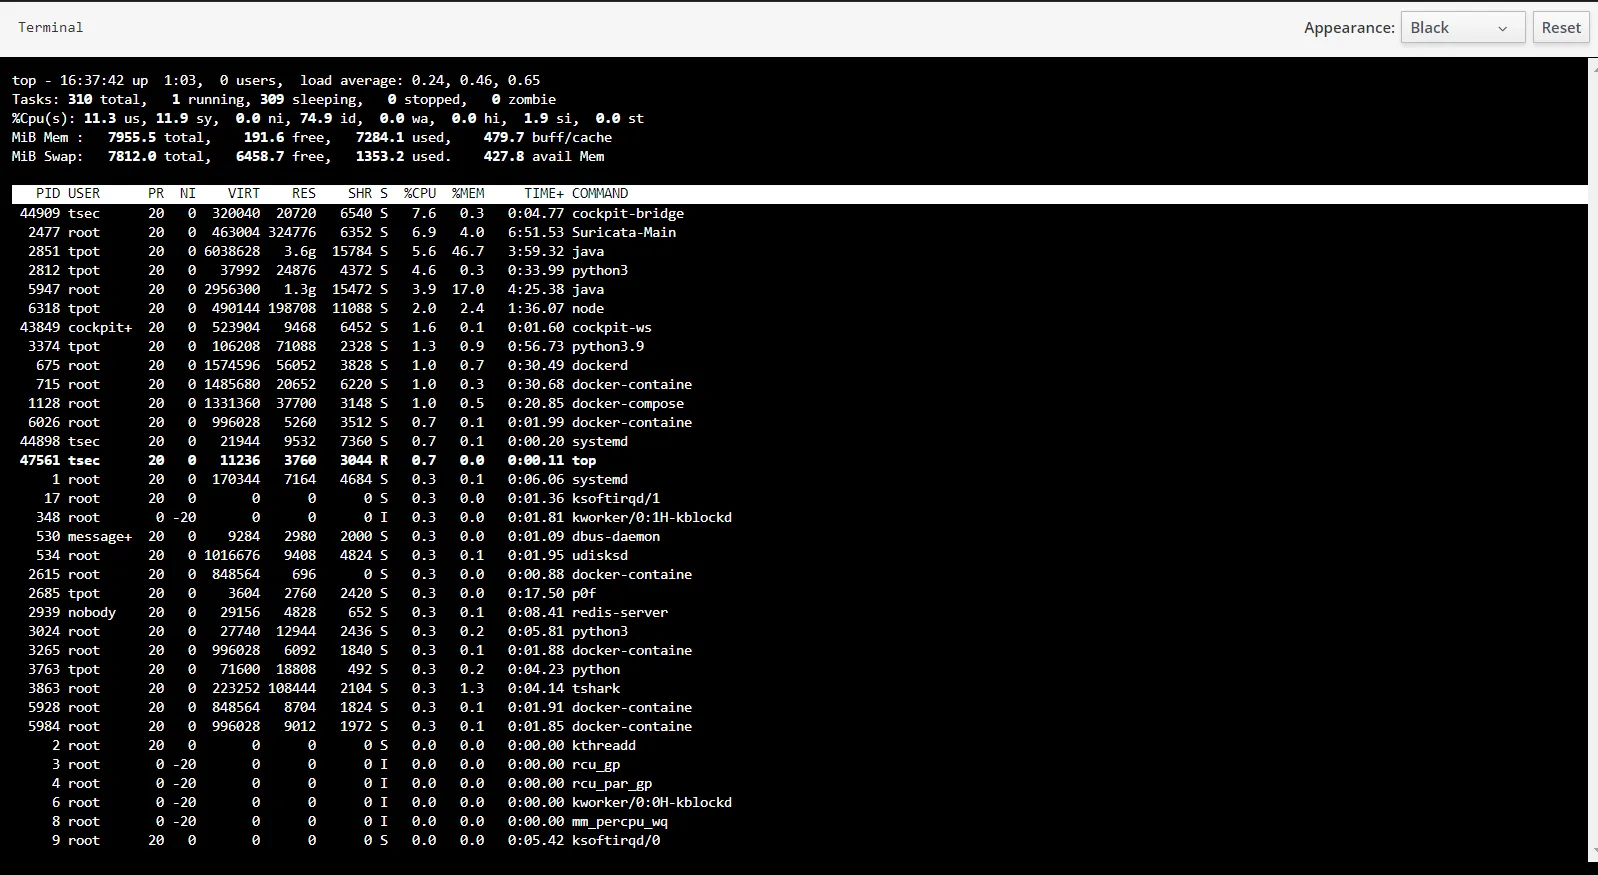
- We type the “top” command into the terminal screen to view the status of the currently running processes in real time.
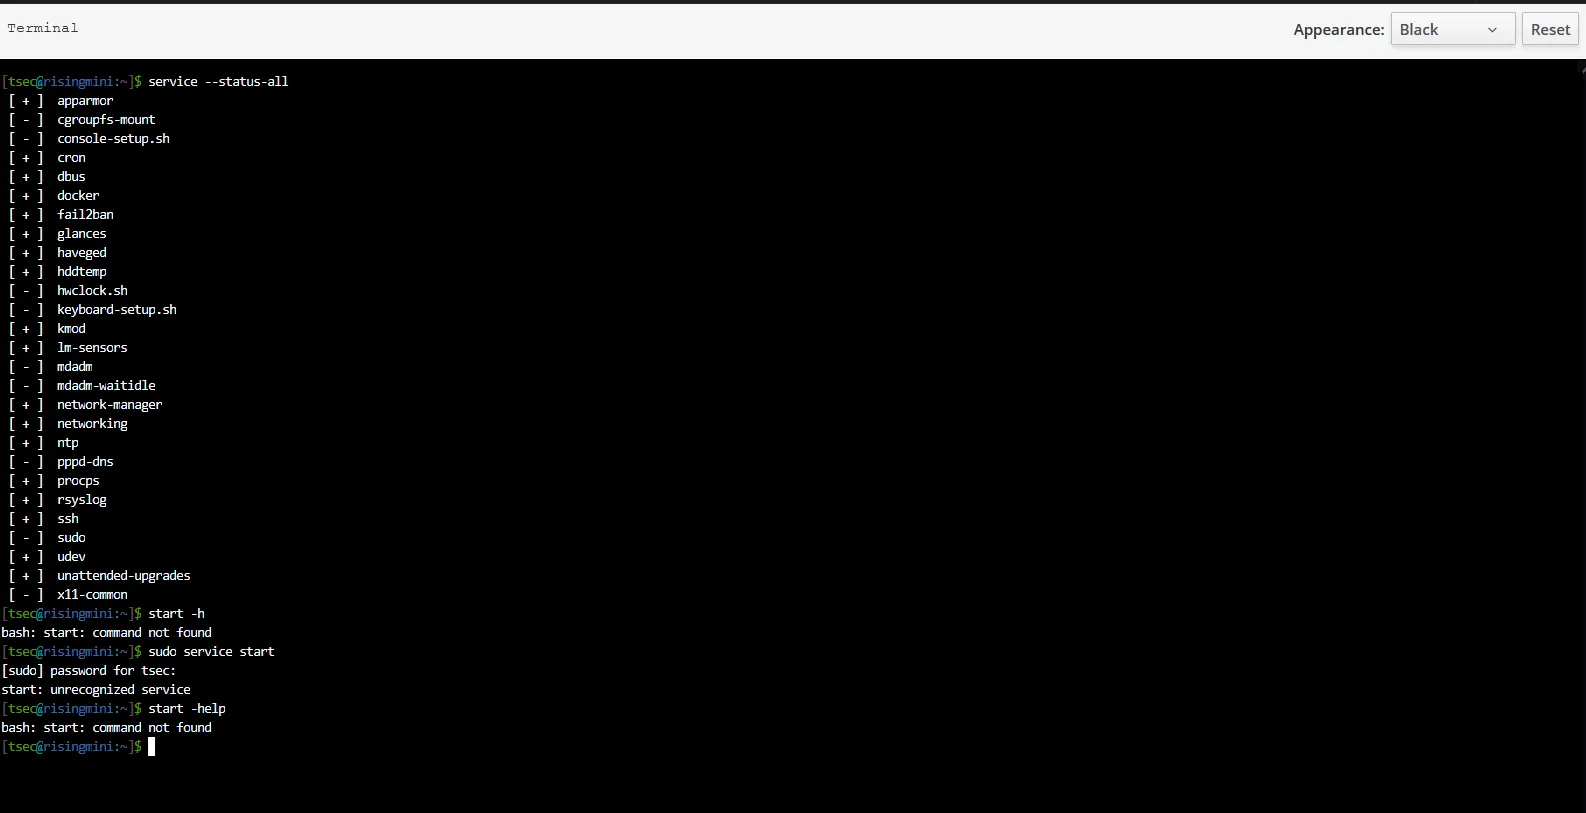
- Here we also view the status of all services.
- Next, we change the URL to access the Operations Center. And again we enter our username and password.
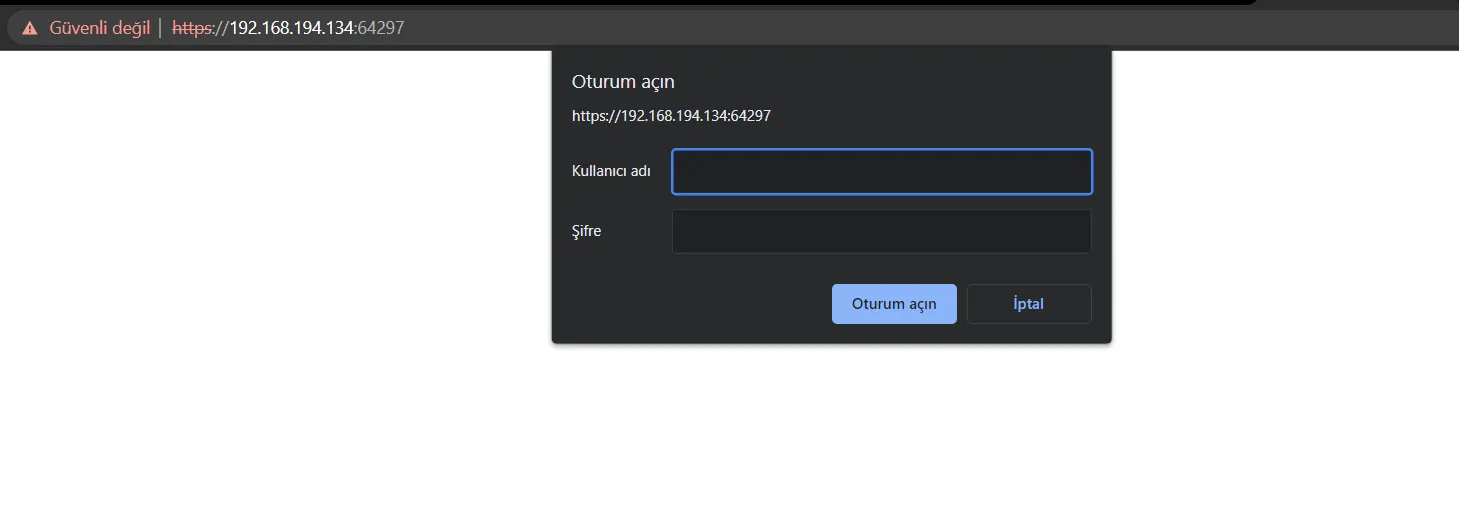
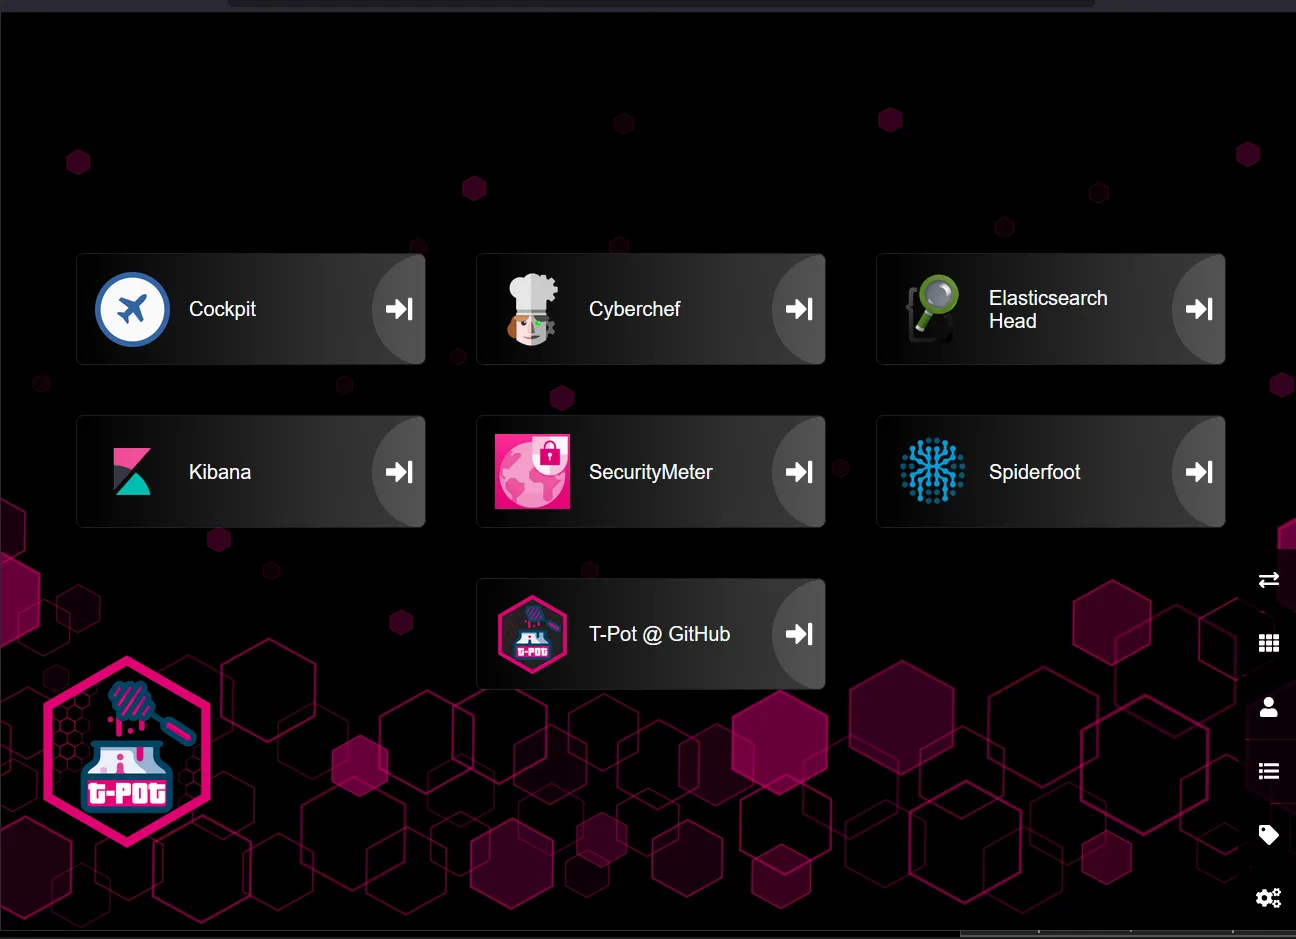
- Using the Operations Center is quite simple, as shown below. We access the Kibana interface.
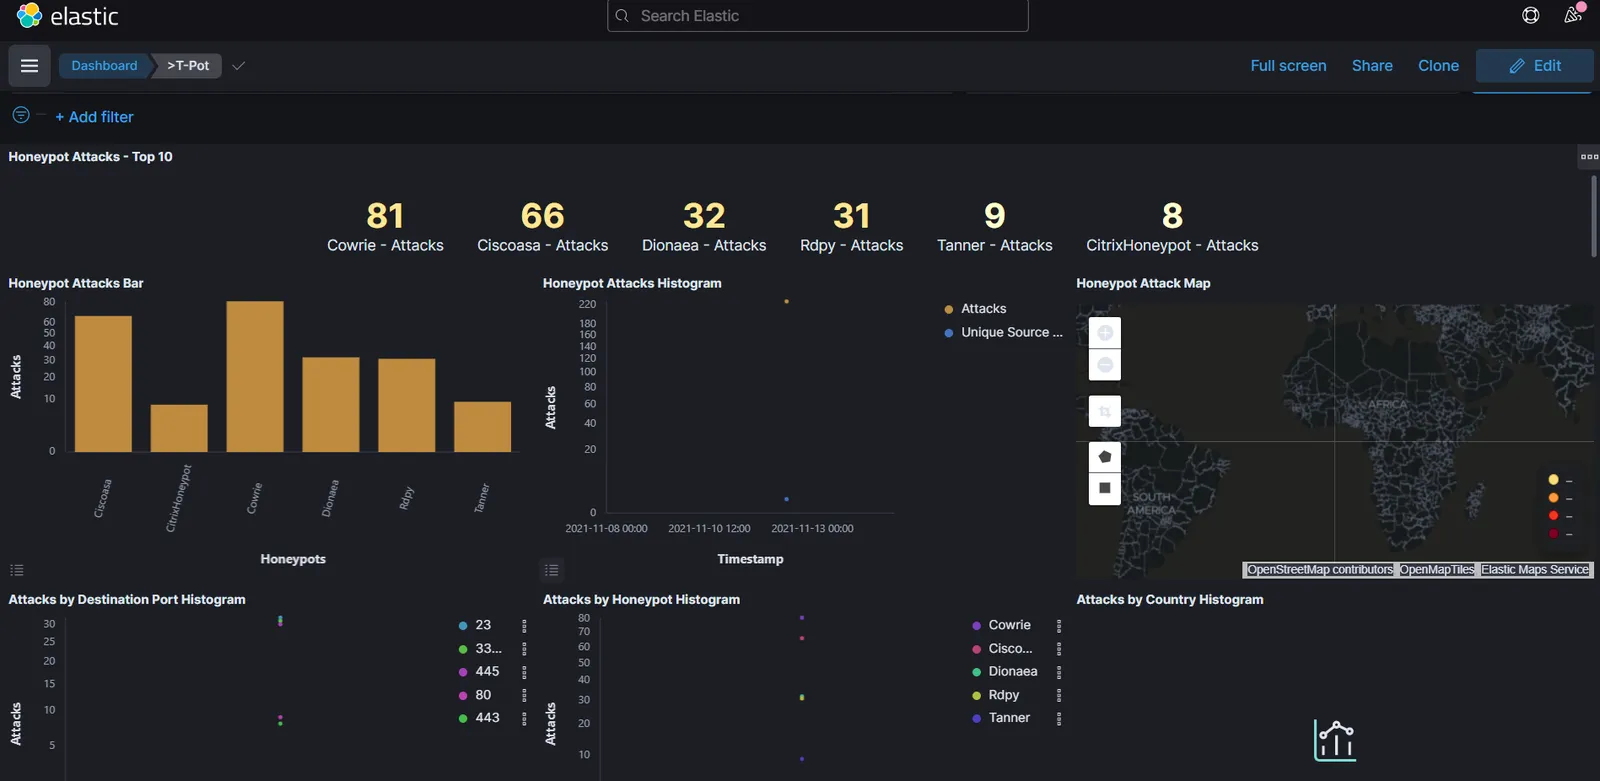
- You can access the Kibana interface as shown below. And from here you can monitor the logs and analyze the traffic.
Getting Caught by T-POT
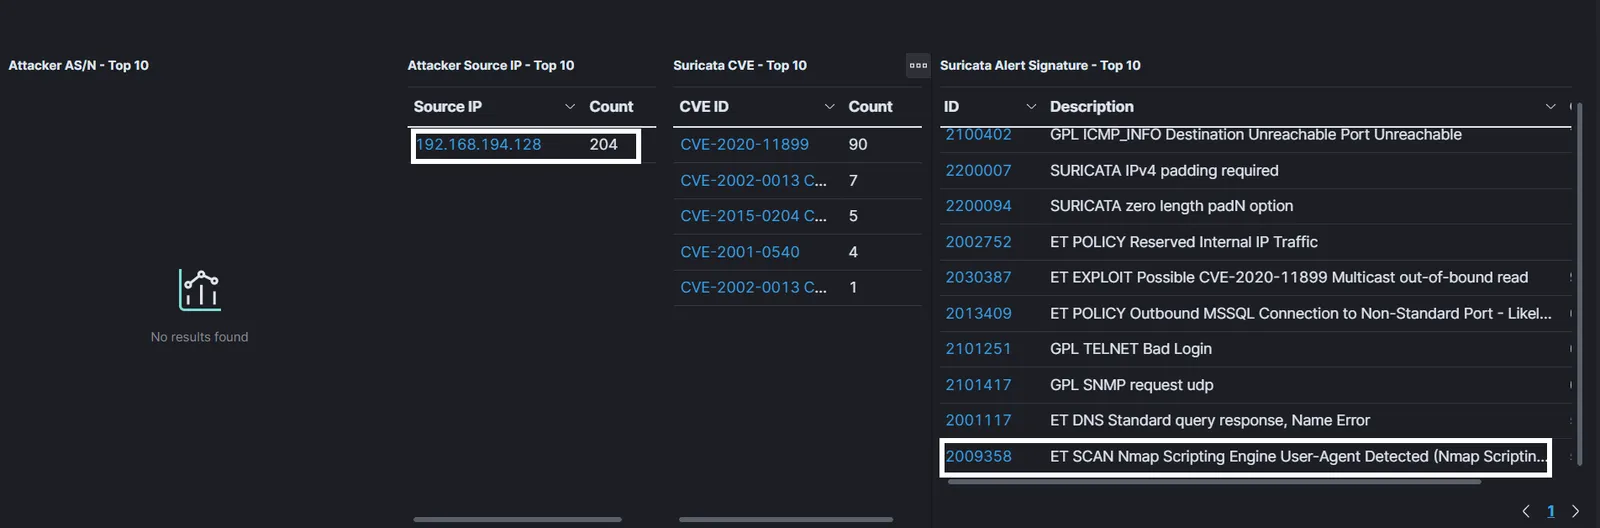
Now I’ll run a simple service scan and show you how the honeypot catches it.
First, I run an nmap scan against some services.
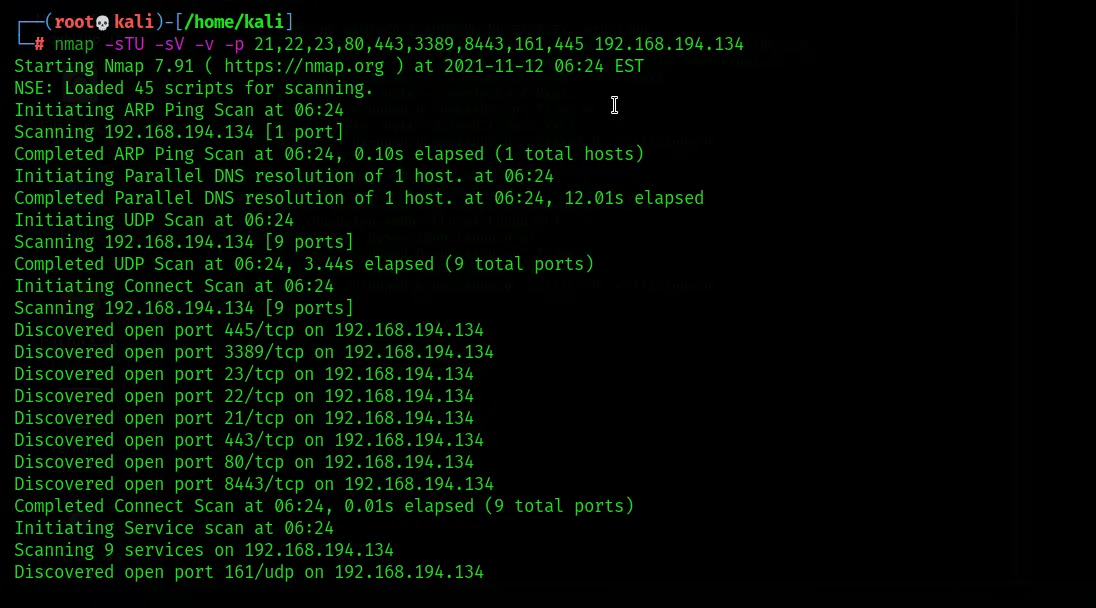
- Here we see that the service scan I ran was classified by Suricata.
Thanks for reading this far. I’d be glad if you reach out to me about anything I missed or got wrong. :)
Sources: